No-code guide
How to backtest a trading strategy without coding
You've got a trading idea. A moving-average crossover, maybe. An RSI bounce. An order block off a liquidity sweep. The question never changes: does it actually work? For years, answering it meant learning Pine Script, MQL5 or Python first. Not anymore.
This is the end-to-end version — picking a market, building the logic, running the test, and pulling it apart to see whether it holds. Every step happens in the browser, and you can do the whole thing free with no signup.
First, what backtesting can and can't tell you
Backtesting means running your rules over historical price data to see how they'd have behaved: every entry, every exit, every win and loss, simulated bar by bar. Done honestly, it's the quickest way to throw out bad ideas and surface the ones worth more attention.
Be blunt about the limits, though, because this is exactly where beginners get burned. A backtest tells you how a set of rules performed on the past. It does not predict the future, and it can't account for everything — surprise news, a liquidity hole, or the plain fact that markets change character. A great-looking backtest is a place to start researching, not a guarantee.
Set the bar honestly. StrategyNodes is a research and education tool, not financial advice, and past performance is not indicative of future results. The job of a backtest isn't to find a strategy that looks perfect on history. It's to find one robust enough to survive conditions it has never seen.
Step 1 — Pick a market and a timeframe
Decide what you're trading and how often. StrategyNodes covers forex, stocks and crypto. Drop a data block on the canvas, choose a symbol — EUR/USD, AAPL, BTC/USD — and set a timeframe, whether that's 5-minute, hourly or daily.
This choice shapes everything downstream. A scalping idea on the 1-minute and a swing idea on the daily are completely different tests. Pick the one you'd actually trade.
Step 2 — Add your indicators and signals
Here's where the idea takes shape. From the indicators category you can drop in an EMA, RSI, Bollinger Bands, MACD, Supertrend and plenty more — 157 blocks across nine categories all told. Wire an indicator into a signal block to turn raw numbers into events: a crossover, a threshold cross, a level break.
Want something more advanced? The structure category carries market-structure and SMC blocks — order blocks, fair-value gaps, liquidity sweeps, supply and demand zones — so you can build the concepts discretionary traders actually use, without reverse-engineering anyone's secret formula.
A strategy here is just a flow: data → indicators → signals → entry/exit logic → risk rules → a Tester that runs it. If you can describe the idea in plain English, you can wire it on the canvas.
Step 3 — Define entry and exit logic
Signals on their own don't trade. You have to say when to act. Flow blocks combine conditions: an AND block fires only when two things are true at once — say, "RSI is oversold and price is above the 200 EMA" — while an OR block fires on either.
Wire those into your entries and exits. Be specific about what opens a trade and what closes it, and keep it simple at first. A tidy core is far easier to read when the results come back.
Step 4 — Add your risk rules
A strategy without risk management isn't a strategy. It's a coin flip with leverage. From the risk category, add position sizing, a stop-loss and a take-profit. Time blocks let you fence trading into specific sessions, like the London or New York open, if that matters to your idea.
The mechanics go as deep as you need — pyramiding, partial exits, pending orders are all on the table. Start basic, with fixed size and fixed stops and targets, then refine once you trust the core.
Step 5 — Turn on realistic costs
This is the step beginners love to skip, and it quietly ruins more backtests than anything else. Real trading costs money. Spread, commission and slippage chip at every trade, and a strategy that prints on "clean" prices can flip straight to a loser once you charge for them.
StrategyNodes models spread, commission and slippage and fills trades intrabar using 1-minute data, so your stops and targets trigger roughly where they really would. Switch costs on before you judge anything. A strategy that only works for free doesn't work.
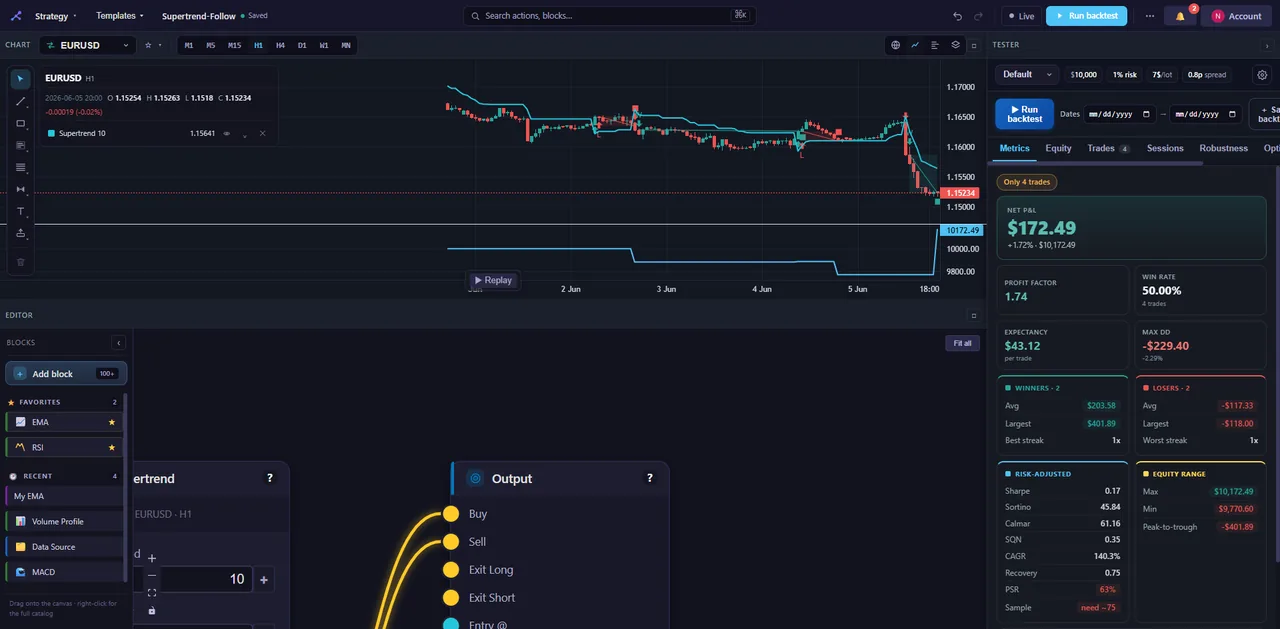
Step 6 — Run it and read the results
Connect everything to the Tester block — the output that runs the backtest — and hit run. You get:
- an equity curve: the shape of the account over time. You want a steady climb, not a spike and a cliff;
- trade markers on the chart, so you can see exactly where each entry and exit landed;
- the core metrics: net P&L, win rate, profit factor, max drawdown, Sharpe, expectancy and more.
Read them together, never alone. A high win rate means little if the losers are enormous. Profit factor above 1 says the wins outweigh the losses. Max drawdown is the worst peak-to-trough drop — and the honest question is whether you could actually sit through it without bailing.
Step 7 — Pressure-test it
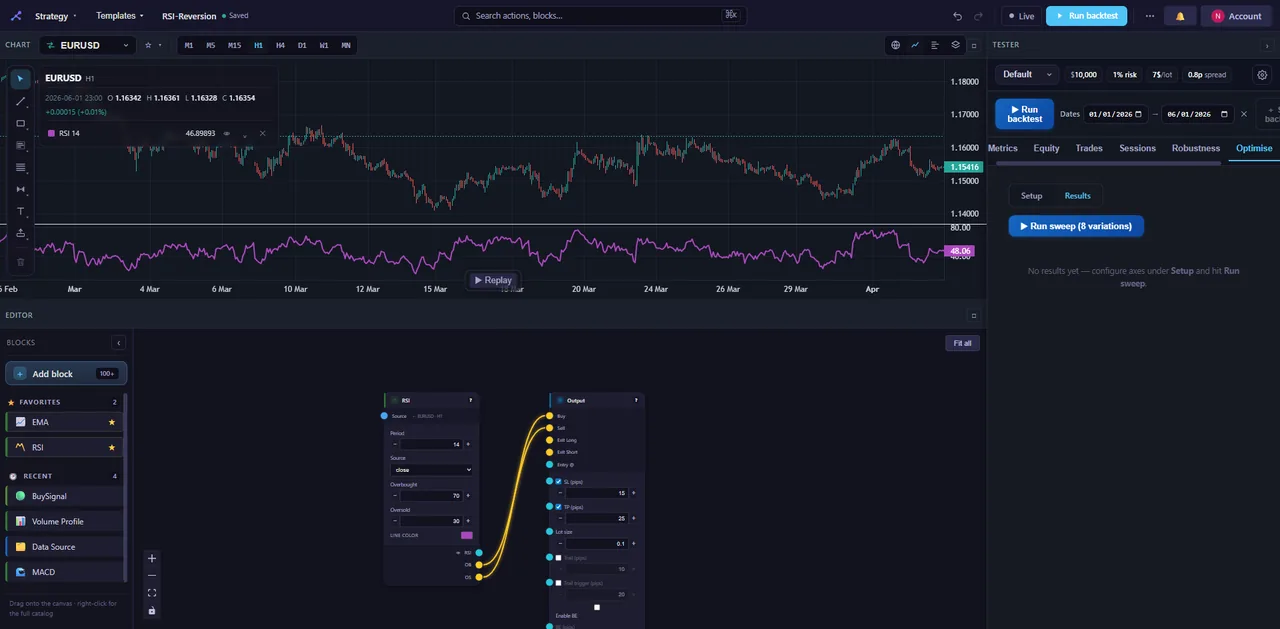
One good-looking backtest proves almost nothing. The real test is whether the edge survives a poke, and this is the stage where most "amazing" strategies come undone — which is a feature, not a bug. (We get into why in why backtests lie.)
- Monte Carlo shuffles your trade order to show a range of outcomes, not just the one lucky path you happened to draw.
- Walk-forward optimisation tunes on one slice of history and tests on the next, mimicking how you'd actually trade it going forward.
- Parameter sweeps reveal whether your settings sit on a stable plateau or a knife-edge.
- Multi-timeframe and multi-symbol testing — a real edge usually shows up on more than one market and survives a higher-timeframe filter.
Tie it together with the StrategyNodes Score: a 0–100 rating and a letter grade that actively hunts for overfitting using the Probabilistic Sharpe Ratio, the Deflated Sharpe, a cross-market holdout and a set of honesty checks. It exists to call out a strategy that's been curve-fit to look good. Here's how the Probabilistic Sharpe Ratio works, and why it's worth your attention.
Step 8 — Export it, if it holds up
Survive the pressure tests and you can take the strategy live elsewhere. StrategyNodes exports to TradingView Pine and MetaTrader MQL5, and the export reproduces the strategy you built in the app. The code is yours — paste it into your platform and go. Curious how that stacks up against writing Pine by hand? We compare them in Pine vs no-code backtesting.
The mistakes worth avoiding
Knowing the traps is half the job:
- Overfitting. Tweaking parameters until the curve looks perfect just memorises the past, and the past won't repeat. Lean on the Score and walk-forward to catch it.
- Ignoring costs. Always test with realistic spread, commission and slippage on. Always.
- Too few trades. Eight trades isn't a test, it's an anecdote. You need a meaningful sample before any metric means a thing.
- One period only. A strategy that crushed 2021 may have died in 2022. Test across different conditions, multiple symbols, and out-of-sample data.
You don't have to start from a blank canvas
If a blank canvas feels intimidating, don't begin there. StrategyNodes ships with around 30 prebuilt templates: load one, see how it's wired, run a backtest, and start tweaking. It's the fastest way to learn the workflow, and often the fastest route to a strategy you actually like. When you want to go deeper, the getting-started docs walk through every block category. And you can start free, no signup — build and run a real backtest in your browser right now.
Build and backtest your first strategy
Drag blocks, wire your logic, and run a realistic backtest in minutes — no code, no signup to try.
Open the builder →