Robustness
What is the Probabilistic Sharpe Ratio? (in plain English)
A Sharpe ratio of 1.5 looks fantastic on a backtest report. But "looks fantastic" and "is real" are two different questions, and the distance between them has quietly ended a lot of trading accounts. The Probabilistic Sharpe Ratio answers the second one: how sure can you actually be that the edge isn't just luck?
Why the plain Sharpe ratio can fool you
The classic Sharpe ratio is a single number: average return divided by the volatility of those returns. Higher is better, and most people treat it as a verdict. Strategy A scores 1.5, strategy B scores 0.9, A wins, conversation over.
The snag is that a Sharpe ratio is an estimate, not a fact. It's measured from a finite run of trades, and like any estimate it comes wrapped in uncertainty. Two things in particular can puff it up well past what it has earned.
Short track records, first. Flip a coin five times, land four heads, and you don't declare it rigged — you simply don't have enough flips. A Sharpe of 1.5 over six months is the trading version of four-from-five. Maybe it's skill. Maybe it's a hot streak. The maths honestly can't tell yet.
Then there's the shape of the returns. The standard Sharpe quietly assumes they're bell-curved and well-mannered, and real trading returns rarely are. Strategies that sell volatility or fade reversals love to bank a stream of small wins while hiding the occasional brutal loss. That buried tail doesn't touch the Sharpe until the day it shows up, so the number flatters the strategy right until it doesn't.
A Sharpe ratio tells you how good a strategy looked. The Probabilistic Sharpe Ratio tells you how much to believe it.
What PSR actually measures
The Probabilistic Sharpe Ratio, introduced by David Bailey and Marcos López de Prado, changes the question. Instead of handing you a point estimate, it hands you a probability.
PSR is the chance that your strategy's true Sharpe — the one you'd see with infinite data — is greater than a benchmark you choose (often zero, meaning "any edge at all"). It weighs three ingredients:
- your observed Sharpe ratio — what the backtest printed;
- the number of observations — how long the track record is;
- the shape of the returns, captured by their skewness and kurtosis.
So "Sharpe = 1.4" becomes something like "I'm 87% confident the real Sharpe clears zero" (illustrative). A flattering-but-fragile number turns into an honest statement of confidence. Under the hood, PSR is the normal CDF of a statistic that grows with (observed Sharpe − benchmark) × sqrt(n − 1), then adjusted for skew and fat tails — but you never need to touch the formula to read the result.
The three things that move it
Track-record length
The intuitive one. The longer a strategy has run — more trades, more regimes survived — the more the maths trusts it. A great Sharpe over thousands of observations is hard to fake. The same Sharpe over a few dozen is barely distinguishable from noise. Stretch the sample and hold everything else fixed, and PSR climbs.
Skewness
Negative skew means a run of small gains punctuated by the odd large loss — picking up coins in front of a steamroller. The plain Sharpe never sees the steamroller, so it over-rates these strategies. PSR won't: negative skew drags it down, because a smooth-looking equity curve with a fat left tail is more dangerous than it appears.
Kurtosis (fat tails)
Fat tails mean extreme outcomes, up and down, turn up more often than a bell curve predicts. That makes any single Sharpe noisier and less reliable, so it pulls PSR down too. The theme stays consistent: the further your returns wander from a clean normal shape, the less a given Sharpe deserves your trust, and PSR bakes that scepticism in for you.
The shorthand: PSR rises with longer track records and falls with non-normal returns. A high Sharpe earned over a short, lumpy, fat-tailed sample can still produce a low PSR — which is precisely the warning you want before risking real money.
An illustrative example
Picture two versions of the same strategy, both reporting a Sharpe of 1.5. (Numbers here are invented, purely to make the point.)
- Version A ran for six months. Few observations, plenty of room for luck — its PSR might land around 70%. Interesting, not convincing.
- Version B ran the identical logic for three years. Same Sharpe, six times the data — PSR might reach the mid-90s.
Same headline, very different confidence. The plain Sharpe calls them equals. PSR doesn't. And if Version B also carried ugly negative skew, its PSR would get pulled back down again — the maths refusing to be impressed by a long but lopsided record.
The Deflated Sharpe Ratio: paying for every guess

PSR kills one illusion. A sneakier one is still standing. Suppose you test 200 variations — different indicators, thresholds, stop levels — and keep the best-looking one. Even if not one of them has a genuine edge, chance alone guarantees the best of 200 will look good. The more variants you try, the higher that "winning" Sharpe drifts, with nothing real behind it. This is selection bias, and it's how most overfit strategies get born. (We pull that thread in why backtests lie.)
The Deflated Sharpe Ratio extends PSR to deal with exactly this. It raises the bar your strategy has to clear, in proportion to how many trials you ran and how varied their results were — essentially charging you for every lottery ticket you bought. A Sharpe that survives the DSR has beaten not just zero, but the inflated number you'd expect from sheer trial-and-error. It's the gap between "best of 200 guesses" and "genuinely better than guessing."
Using PSR and DSR in practice
You don't need the formulas memorised. You need them in your decision rule:
- Stop reading the Sharpe alone. Treat it as a headline, then check the PSR behind it.
- Demand a real track record. A high PSR over a long sample beats a high Sharpe over a short one, every time.
- Be honest about how many variants you tried, and let the DSR raise the bar accordingly. That's the entire point of it.
- Watch the shape, not just the size. Negative skew and fat tails are quiet risks; let PSR's scepticism steer you toward strategies whose returns are as clean as their numbers.
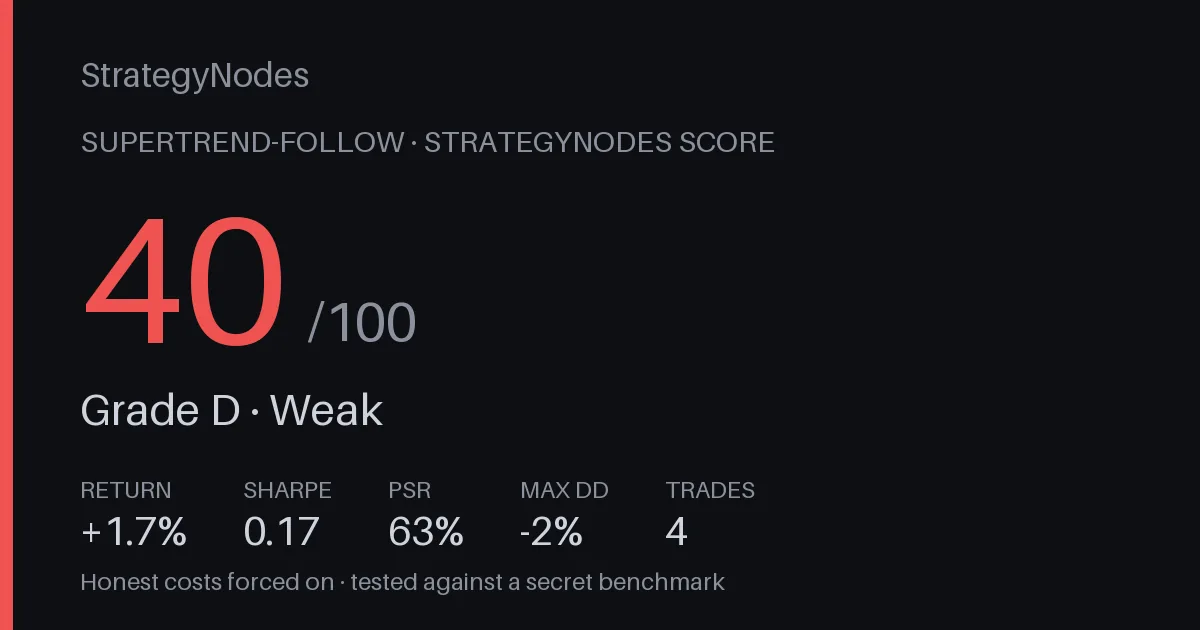
Where the StrategyNodes Score comes in
Computing PSR and the DSR by hand — pulling skew, kurtosis, observation counts and trial counts into the right statistics — is tedious and easy to get wrong. So StrategyNodes does it for you. It's a no-code, browser-based builder and backtester for forex, stocks and crypto: you drag blocks, wire them together, and test, with no Pine, MQL5 or Python anywhere. Every backtest gets a StrategyNodes Score that computes the Probabilistic and Deflated Sharpe and folds them into a single 0–100 number and a letter grade, sitting alongside a cross-market holdout, honesty checks and a hidden benchmark — all pointed at catching overfit strategies before you lean on them.
Backtests run with realistic costs (spread, commission, slippage, intrabar M1 fills) and the full robustness suite — Monte Carlo, walk-forward, parameter sweeps. When a strategy holds up, you can export it straight to TradingView Pine or MetaTrader MQL5. If you'd rather start by building something, here's how to backtest a strategy without coding.
The aim was never a higher number. It's knowing whether the number you've got is real — and PSR and DSR are how serious quants answer that.
StrategyNodes is a research and education tool. Nothing here is investment advice, and no statistic can promise future results. Past performance is not indicative of future results.
Get the Score on your own strategy
Build a strategy, backtest it, and see its Probabilistic & Deflated Sharpe, cross-market holdout and grade — in one click. No signup to try.
Open the builder →